Eval of anticancer:
Need for new drugs
- Despite the major advances that have been made in the treatment of malignancy, many patients still die either from unresponsive tumors or recurrent disease
- Need for anticancer drugs that would eradicate cancer cells without harming normal tissues
- Need for anticancer agents that would target resistant cancer cells
- Human tumor stem cell (HTSC) assay/ Clonogenic Assay
- Disease-orientated – model system incorporating multiple tumors cell of the same histotype
- Soft agar colony growth of freshly explanted human tissue is taken
- Outcomes are based on growth inhibition
- Initial studies found that most drugs were active with the exception of drugs requiring systemic activation
- HTSC assay – for evaluating efficacy of clinically active agents and individualizing cancer treatment
Limitations
- Low plating efficiency of most solid tumors
- There are no phase III clinical studies of individualized therapy demonstrating a significant increase in survival compared with empirically determined standard treatment
- Therefore, the HTSC assay has not found a role in the individualization of patient therapy
- Human tumor cell line assay
- The initial cell line panel incorporated a total of 60 different human tumor cell lines of diverse histology
- Different types of cancer including drug-resistant cell lines included
- nonclonogenic protein stain sulfo-rhodamine B assay (38) is used to determine cell viability
- Each compound is tested over a 5-log concentration range against each of the 60 cell lines
- These data generate characteristic profile or ‘‘fingerprint’’ of cellular response, i.e. the ‘‘mean graph’’
- ‘‘COMPARE’’ is a computerized, pattern recognition algorithm used in evaluating and exploiting the fingerprint data in order to determine the degree of similarity between mean graph profiles generated by similar or different compounds
Implications
- The sensitivity of a cell line, along with knowledge of its molecular characteristics may indicate that a compound’s action is mediated by its interaction with molecular target
- Alternatively, differential expression in the form of a mean graph may indicate why particular cell lines may be resistant to a test compound
- Endpoints –
- GI50 (concentration required to inhibit 50% of cells)
- Total growth inhibition
- LC50 (concentration required to kill 50% of cells)
Limitations
- Factors other than the inherent chemo sensitivity of tumor cells significantly influence the outcome of chemotherapy in vivo (e.g., pharmacokinetics, tumor micro regions/pH)
- Not sufficiently discriminatory to ensure that only a relatively small number of compounds would be selected for further evaluation in human tumor xenograft models
Preclinical toxicity study
- Aimed at predicting
- Safe starting dose & dosage regimen for human clinical trials(P1)
- The toxicities of the compound, &
- The likely severity and reversibility of drug toxicities.
- Regulatory requirement : Two acute preclinical toxicity studies
- Rodent (mice) – single- and multiple-dose lethality studies.
- Non rodent (dogs) – single- and multiple-dose confirmatory toxicity.
- Cytotoxic & non cyotoxic drugs
Acute toxicity studies
- First mouse given a single injection (IP, IV, SC, IM or PO) of 400 mg/kg (or lower if the compound is extremely potent)
- Second mouse receives a dose of 200 mg/kg and a third mouse receives a single dose of 100 mg/kg
- The mice are observed for a period of 2 weeks
- They are sacrificed if there are signs of significant toxicity
- If all 3 mice must be sacrificed, the next 3 dose levels (50, 25 and 12.5 mg/kg) are tested in a similar manner This process is repeated until a tolerated dose is found
- This dose is then designated as MTD
- For the standard hollow fiber assay (HFA), the high and low dose levels are determined using the MTD the formula below
- High dose = [MTD x 1.5]/4
- Low dose = 0.67 x high dose
Hollow fiber assay
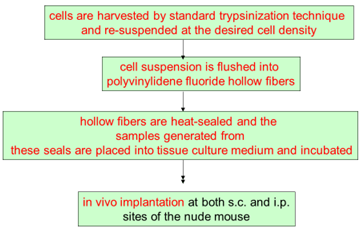
- Mice treated with experimental agents starting on day 4 following fiber implantation and continuing 4 days
- Each agent administered by i.p injection at 2 dose levels. The doses are based on the maximum tolerated dose (MTD)
- The fibers are collected from the mice and subjected to the MTT assay
- The percent net growth in each treatment group is calculated and compared to the percent net growth in controls
- A 50% or greater reduction in percent net growth in the treated samples compared to the vehicle control samples is considered a positive result
Implications
- The HFA assesses the pharmacologic capacity of compounds to reach physiologic compartments and shows a practical means of quantifying viable tumor cell mass
- It is relatively rapid and cost-effective demonstration of in vivo activity
- HFA as an in vivo prescreen is good predictor of in vivo xenograft activity which is the next step in preclinical screening
Human tumor xenograft models
- Xenograft tumors are established by the s.c inoculation of tumor cells into nude mice
- Growth of solid tumors monitored using in situ caliper measurements
- Activity is defined by
- Tumor growth delay
- Net tumor cell kill T/C ( T/C – median treated tumor mass/median control tumor mass)
- Drug-related deaths and body weight loss are used as parameters of toxicity
Limitation
- Requirement for an immunocompromised host
- Not all tumor systems can be studied by xenograft model
- Inability of these models to fully resemble the complex relationship between the tumor and its microenvironment (e.g., angiogenesis)
- Most importantly, the ability of xenografts to predict drug efficacy in human cancer patients has been disappointing
Orthotopic and metastatic tumor models
- Organ environment can influence the response of tumors to chemotherapy
- As s.c. tumor models are not representative of the primary tumor site
- In addition, clinically we treat well-established and advanced metastatic disease
- Thus, orthotopic tumor models seem to be more representative of a primary tumor with respect to tumor site and metastasis
- Advantage – orthotopic model is targeting processes involved in local invasion (eg, angiogenesis) & is undertaken at a more clinically relevant site
- Disadvantage –
- need for a high level of technical skill, time, and cost
- Therapeutic efficacy more difficult to assess with orthotopic models in contrast to the relative ease of s.c. tumor
Autochthonous models
- Autochthonous tumors include spontaneously occurring tumors and chemical, viral, or physical carcinogen-induced tumors
- Advantages of autochthonous tumors include orthotopic growth, tumor histology devoid of transplantation introduced changes, and metastasis via lymphatic and vascular vessels
- Outcomes compared from autochthonous models and GEMs found that autochthonous models correlated best with clinical responses
Limitations
- Autochthonous tumor models have an inherent variability in the time, frequency, number of tumor(s) induced and thus the number of animals required
- Time required – several months to a year, as opposed to weeks with transplanted xenograft models
- Thus, autochthonous tumor models are best reserved for confirmation
Genetically engineered mouse models
- Genetically engineered mice are predisposed to cancer by introducing cellular/viral oncogenes into the mouse germ line
- Have highlighted the importance of specific oncogenes and tumor suppressor genes
- GEM models resemble genetic/molecular changes in human cancer & are used to test novel anticancer therapeutics
- Genes targeted to mouse embryonic stem cells, result in oncogene -bearing transgenic mice i.e., gene knockout mice
Implications
- GEM models possess well validated drug targets and may potentially offer a more appropriate preclinical model
- Additionally, GEM tumors develop autochthonously /in situ and therefore may be more biologically representative of a particular tumor type in humans
Limitations
- GEM models are expensive and time consuming
- Their use is often restricted by intellectual property rights and patents
- In addition to embryonic lethality, mice often do not develop the expected tumor type as they may die prematurely
- The genetic background can affect transgene expression where outcome like rapidity of lesion ,type of lesion and tumor histiotype are affected by genetic background
- Clinical evaluation general points
- Single arm studies
- Non inferiority studies
- Design for protectants
- Endpoints
- DFS (Disease free survival): time from randomization to tumor recurrence or death d/t any cause
- Used in the setting of-
- After definitive t/t
- When a large percentage of patients achieve complete responses with chemotherapy
- In situations where survival may be prolonged, making a survival endpoint impractical
- ORR (Objective response rate): proportion of patients with a tumor size reduction to a predefined amount
- ORR is a direct measure of drug antitumor activity, which can be evaluated in a single-arm study
- TTP (Time to progression): time from randomization until predefined tumor progression. Doesn’t include death
- PFS (Progression free survival): TTP and death
- Whether an improvement in PFS represents a surrogate for clinical benefit depends on the magnitude of the effect & risk-benefit compared to available therapies
- Define tumor progression criteria in the protocol
- Visits and radiological assessments should be symmetric between the two study arms to prevent systematic bias
- Studies should be blinded
- TTF (Time to treatment failure): time from randomization to t/t discontinuation d/t any cause [disease progression, toxicity or death]. But it cannot be a regulatory endpoint since it doesn’t distinguish efficacy from other parameters
- Biomarkers
- Generally, biomarkers assayed from blood or body fluids have not served as primary endpoints for cancer drug approval
- Further research is needed to establish the validity of available biomarkers and determine whether improvements in biomarkers predict clinical benefit
- Biomarkers can be useful in identifying prognostic factors and stratification factors to be considered in study designs.
- Phases
- Phase 1:
- Design: Conventional Fibonacci approach OR Statistically based dose escalation model.
- Ethical issues.
- Endpoints. Response rate, toxicity and clinically meaningful endpoints
- Phase 2:
- Randomized selection design
- Design with reference standard t/t control arm
- Phase 2/3 study design