Sample size
• Sample allows extrapolation of results to the Sample allows extrapolation of results to the general population.
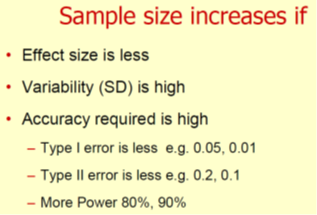
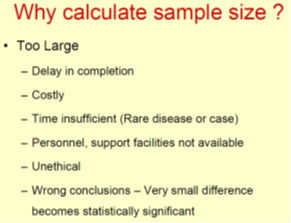
• We can make statistical errors when sample size is not correct size is not correct size
– Type I or alpha error (p value) False +ve
– Type II or beta error False –ve
• Mandatory in RCT– Consort statement 7a, ICH E9 guidelines
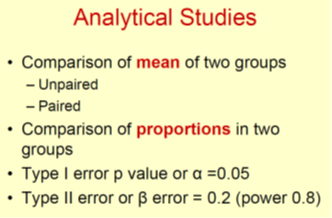
Type I or Alpha error ( α)
• False +ve error
• Finding a difference when none exists
• p value is fixed at 5%
• 95% confident of finding a difference
• There is 5% probability of getting a difference by chance variation
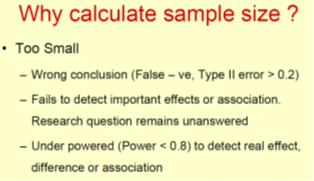
Type II or beta error ( β)
• False –ve error
• β error should be less than 0.2 or 20%
• Not finding the difference when it really exists
• Power (1 – β) is the ability to detect difference when it really exists
• If sample size increase then β error reduces or power of a test increases.
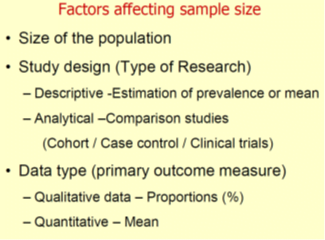
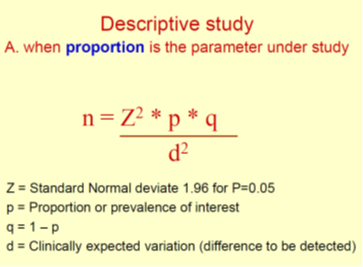
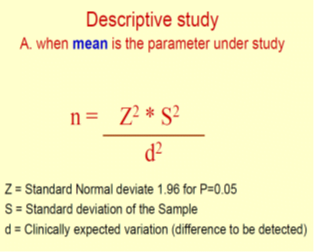
Elements that are Used to Calculate Sample Size
Different elements are used to calculate sample size depending upon the study design
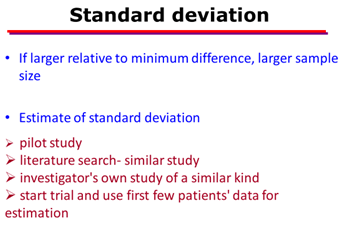
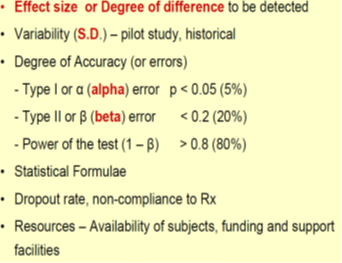
- Variance or heterogeneity in the population
- index of how widely individuals in a group vary with respect to the measure of interest.
- When the observations in a sample or population differ widely from each other, a large variance is said to exist and vice versa.
- Mathematically, the variance is equal to the square of the standard deviation (SD; σ).
- Standard Normal Deviate (zα)
- Alpha (a) error (also called the false positive error )
- Beta (β) error (also called the false negative error )
- Power of the study (1- β)
- Precision (margin of error )
- Is the margin of error that we deem acceptable in a study. For example, this could be as low or as stringent as 1% or as high as 10%. The latter, for example, may be acceptable for an exploratory study.
- Confidence interval
- is the margin of uncertainty around the findings
- Odds ratio (OR)
- is a versatile and robust statistic that gives information on the strength of a relationship between two
variables when the outcomes are binary outcomes
Odds ratios are most commonly used in case-control studies
they can potentially can be used in other study designs like cross-sectional and cohort studies subject to some modifications and/or assumptions.
Tails of a test-
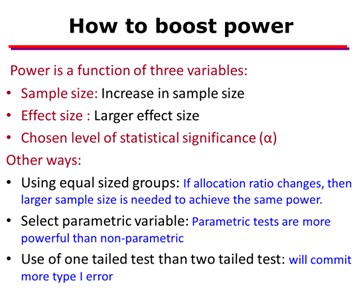
When two group comparisons are made, the p value is reported as a one-sided or one-tailed or a two-sided or a two-tailed p value (the words “tail” and “side” are used synonymously). This primarily refers to the “direction” of movement of the outcome of interest.
example. Let us say that we are evaluating a new drug for the prevention of mother to child transmission.
We know that this new drug can either decrease mother to-child transmission or not have an effect but certainly
cannot “increase” it.
Thus, in this case, we use a “one-sided” test.
On the other hand, if we were evaluating a new antidiabetic drug, we start by saying that the blood sugar in the study, which is the outcome of interest, can stay the same, increase or decrease after treatment. It does not
mean that the anti-diabetic drug will increase the blood sugar by itself, but we allow for the fact that the drug may
not work and hence the blood sugar can rise. We thus use “two-sided “ tests here.
Prevalence-
primarily refers to the percentage or proportion of patients or participants who have the characteristic of interest.
Estimated design effect (DEFF)
Most statistical test are applied under the assumption that the data has been collected by Simple Random Sampling where no respondent declines participation. However, this rarely happens in real life and we have to “correct” for this by multiplying the sample variance by a constant. This constant will correct for the
departure of the value of the actual variance obtained through non-random sampling from that which would bed
obtained classically through random sampling . This constant is called the design effect
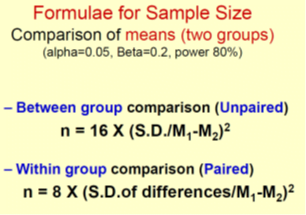
Effect size
is essentially the magnitude of the difference between groups.
Hazard ratio –
Hazard is a measure that is classically used in studies that involve Survival analysis, also called as time to event analysis [e.g.,time to discharge from the hospital, time to metastases, time to disease recurrence].
Hazard ratio can be defined as the chance of occurrence of an event over time.
To give an example, in a two-group comparison, a hazard ratio of 2 for death can be interpreted as one group having twice the chance of dying relative to the other group, over a certain time-period.